

- Bitcoin showed volatility in early 2025, with mixed signals and a slight recovery in February.
- Active addresses correlate with price surges, reflecting increased network engagement.
- Technical indicators suggest potential downside, with low RSI and negative MACD signals.
Bitcoin has continued to show volatility into 2025, with fluctuations throughout January and early February displaying mixed signals. Recent observations from Daan Crypto Trades, a crypto analyst, show a shift in the market dynamic, with early-month price action showing signs of stabilization after a choppy end to 2024.
Despite this, Bitcoin’s movements remain uncertain, as technical indicators show mixed signals, and the market is still digesting the implications of recent price swings.
Bitcoin’s price fluctuations throughout 2024 were marked by declines and brief recovery periods. The year began with a drop of 18.55% in June, when the price fell to $51,750 on June 5th. Additionally, July saw a further 15% decline, taking Bitcoin to $95,851 by July 5th. August experienced a further dip of 23.69%, reaching $151,765 by August 5th.
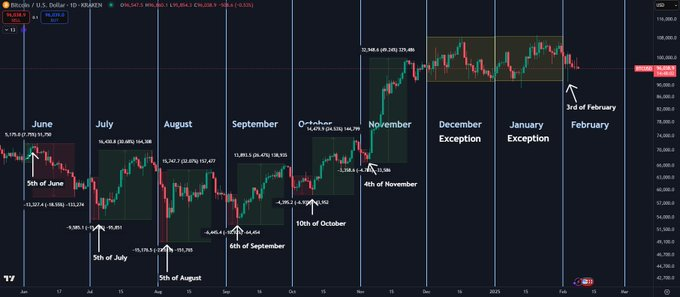
However, the market shifted in September 2024, when the price declined by 10.92% to $64,454. October was another period of volatility, with a 6.93% decrease, bringing the price down to $63,952.
November 2024 stood out for its dramatic 49.24% surge, with Bitcoin reaching $329,486 by the 4th of the month, signaling strong bullish momentum. December 2024, by contrast, was a month with relatively steady price movement. January 2025 followed a similar pattern, with minimal volatility and no major trend direction.
As of February 2025, the month began with a decline of 0.53%, placing Bitcoin at $96,039. However, Bitcoin showed signs of recovery, trading at around $97,135 at the time of writing, with an increase of 1.01% over the previous day.
Bitcoin’s Active Addresses: An Insight into Market Activity
Bitcoin’s price fluctuations have coincided with network activity and levels, as evidenced by spikes in active addresses. These spikes, which reflect the number of different Bitcoin addresses involved in transactions, often align with price movements, particularly during bullish phases.
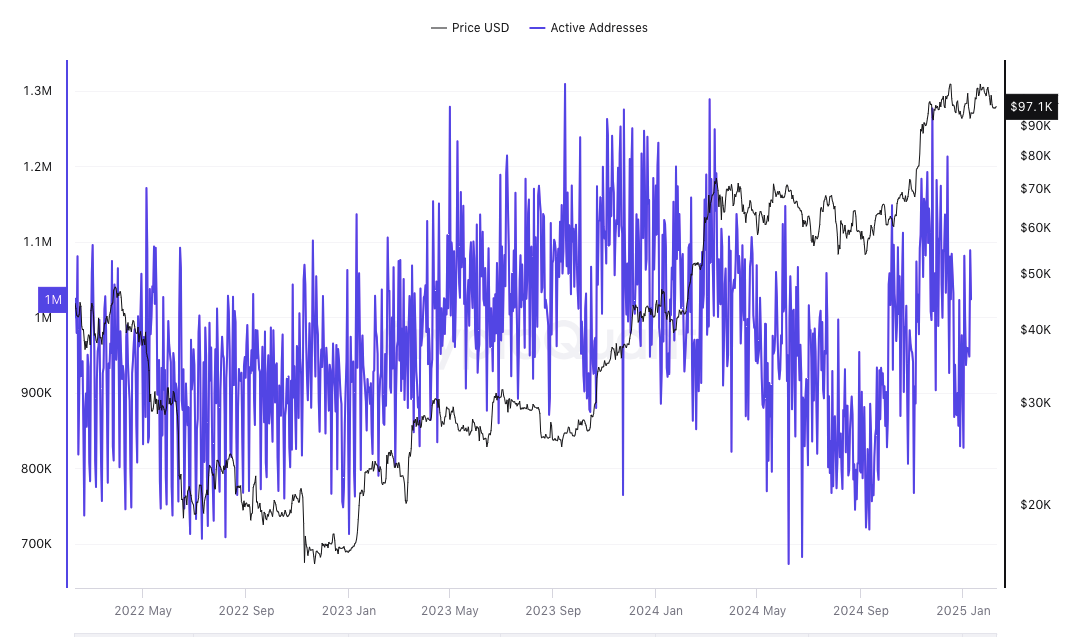
While there are instances where active addresses spiked even without corresponding price increases, most correlations are seen during price surges. For example, Bitcoin’s price recorded gains from late 2023 to early 2024, accompanied by increased active addresses. This suggests that more users were engaging with the network as prices rose.
Technical Indicators: MACD and RSI Analysis
Bitcoin’s technical indicators give an insight into its price movements and possible future trends. As of press time, Bitcoin’s RSI was at 43.75. However, a reading below 50 often suggests that the price may face further resistance, possibly for either consolidation or a mild correction.
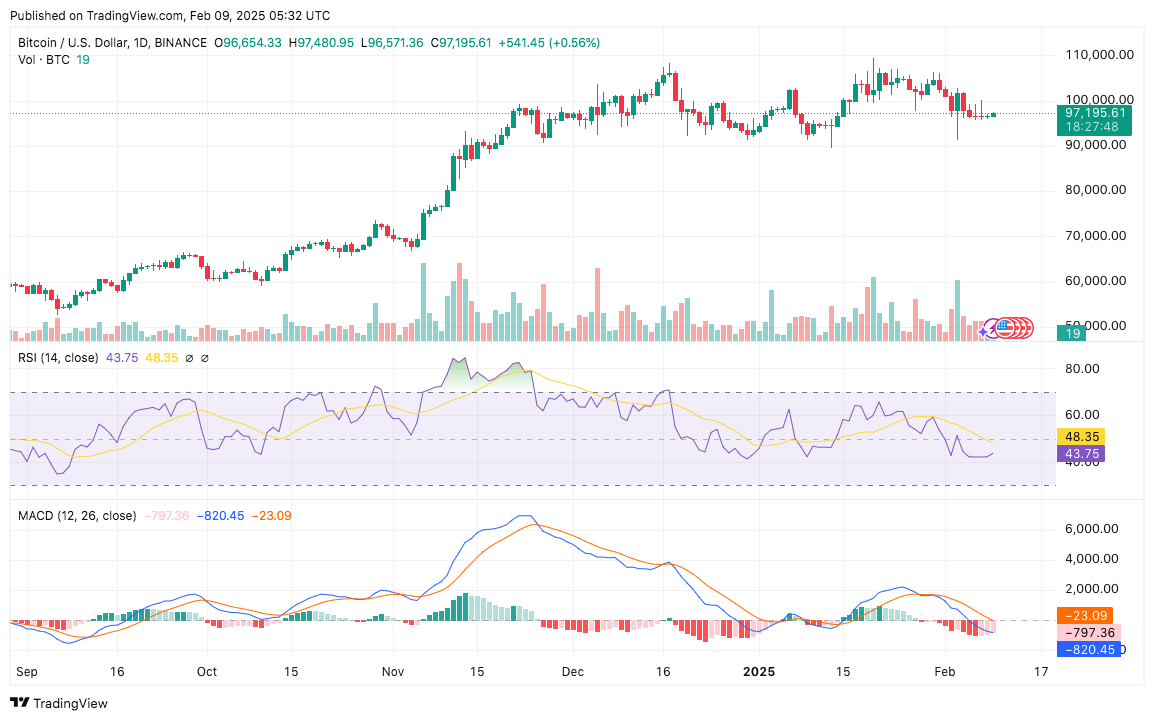
Meanwhile, the MACD shows a bearish outlook. The MACD line is positioned below the signal line, with a value of -797.36, indicating ongoing bearish momentum. The histogram bars, representing the difference between the MACD and signal lines, are also in the negative zone, suggesting that downward pressure persists.
Earn more PRC tokens by sharing this post. Copy and paste the URL below and share to friends, when they click and visit Parrot Coin website you earn: https://parrotcoin.net0
PRC Comment Policy
Your comments MUST BE constructive with vivid and clear suggestion relating to the post.
Your comments MUST NOT be less than 5 words.
Do NOT in any way copy/duplicate or transmit another members comment and paste to earn. Members who indulge themselves copying and duplicating comments, their earnings would be wiped out totally as a warning and Account deactivated if the user continue the act.
Parrot Coin does not pay for exclamatory comments Such as hahaha, nice one, wow, congrats, lmao, lol, etc are strictly forbidden and disallowed. Kindly adhere to this rule.
Constructive REPLY to comments is allowed