The last few weeks have been a rollercoaster ride for Bitcoin Investors and traders. It has been very hard to say if BTC will rise or plummet. In this whole confusion state, investors lost millions in trades. However, bitcoin whales have been accumulating. It has been a full month since Bitcoin last touched the $70k mark. Let’s understand what has been happening in the market.
Fear of MT. Gox sell off
One of the biggest fears of the market has been the sell off by Mt. Gox creditors. Though Mt. Gox has transferred most of the funds to the collaborating crypto exchanges, not all creditors have received them yet. The market has a fear that these creditors once received the funds, will sell off, triggering a negative motion in the market. This fear has been holding the Bitcoin under $60,000 for a month.
Governments triggering Fear
First the German government dumped their 50,000 bitcoin in the market and it was a constant knife over the neck of the market. Now, it looks like the US government is planning to fall in their footsteps.Any action related to crypto on one end and government of a solid nation on the other can heavily impact the market conditions. The movement of Bitcoin from US government wallet to Coinbase triggers the same fear as by Germany.
Market Indications
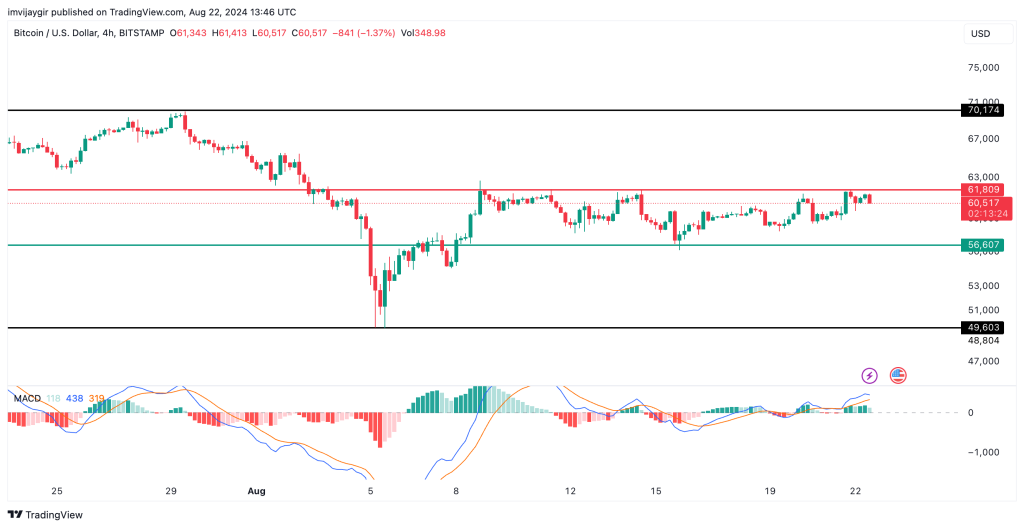
For almost the last 12 days, the price of Bitcoin has been consolidating between the price range of $56,000 and $60,000. There have been mixed reactions from the market leaders. There are some who are predicting a fall while others are showing dreams for a bull run resume.
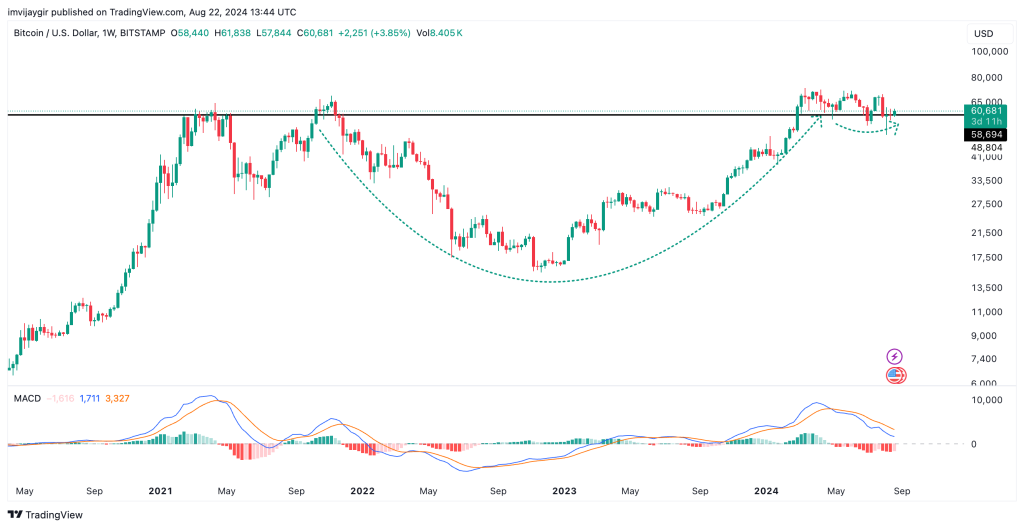
The same confusion can be seen on the charts. Looking at the weekly chart a ray of hope appears. It looks like the market is trying to create a cup and handle pattern, if succeeded, the market will take a rally. However, MACD indicates a rise in bear movement which may cause the market to consolidate more. Failure of the chart pattern may lead to a plummet in price.

If we move to the hourly chart, the consolidation area becomes more clear and the MACD indicator can be seen supporting a bearish sentiment. The market greed and fear index has been under 30 for quite some days which was recorded at 50 today. This rise in greed reflects an increase in the positive market sentiment.

What to expect
Looking at all the above conditions, it is very difficult to predict the next market movement. However if we look at the whale’s accumulation data, the idea becomes clear. When retail investors are scared and draw back from the market, the whales take this opportunity to accumulate more Bitcoin at discounted prices. Until and unless, the price breaks out of the consolidated zone, it is very risky to take any kinds of trades. This time can be used to fill bags and stay aware of the trades. This is not financial advice but merely a simple explanation of the market conditions.
Earn more PRC tokens by sharing this post. Copy and paste the URL below and share to friends, when they click and visit Parrot Coin website you earn: https://parrotcoin.net0
PRC Comment Policy
Your comments MUST BE constructive with vivid and clear suggestion relating to the post.
Your comments MUST NOT be less than 5 words.
Do NOT in any way copy/duplicate or transmit another members comment and paste to earn. Members who indulge themselves copying and duplicating comments, their earnings would be wiped out totally as a warning and Account deactivated if the user continue the act.
Parrot Coin does not pay for exclamatory comments Such as hahaha, nice one, wow, congrats, lmao, lol, etc are strictly forbidden and disallowed. Kindly adhere to this rule.
Constructive REPLY to comments is allowed
