

- Dogecoin trades at $0.21507 after TD Sequential issues a new buy setup on the hourly chart.
- RSI at 40.43 and signal at 44.80 suggest neutral momentum after recent downward pressure.
- MACD at -20.96M highlights reduced bearish strength, while market capitalization holds at $32.34B.
Dogecoin ($DOGE) has shown a new technical setup after the TD Sequential indicator flashed a buy signal. This comes shortly after the tool accurately captured the previous top. At the time of reporting, DOGE was trading at around $0.21507, marking a slight 0.31% increase in 24 hours. The digital asset has seen fluctuations within a narrow range, with momentum indicators now drawing attention to possible shifts. Current data highlights support forming near $0.21460 while resistance remains capped near $0.22150.
TD Sequential and Price Levels
The TD Sequential tool highlighted the recent downtrend, correctly marking the peak before a series of red candles followed. Now, a fresh buy setup has emerged at lower price levels. DOGE’s hourly candlestick chart confirms this alignment, with the latest print coinciding with renewed interest.
Support was tested near $0.21410, while the market continues to respect the broader consolidation range. Resistance at higher levels, particularly near $0.22200, remains intact as the next immediate threshold.
DOGE Holds in Compressed Range as Indicators Signal Easing Bearish Pressure
Notably, the Relative Strength Index (RSI) provides more context to current movements. The indicator reads 40.43, while the signal line registers slightly higher at 44.80. These values suggest reduced momentum after a prolonged corrective phase. Despite recent weakness, the RSI now shows stabilization, keeping DOGE within neutral territory. The RSI pattern also matches the earlier TD Sequential trigger, reinforcing short-term technical signals.
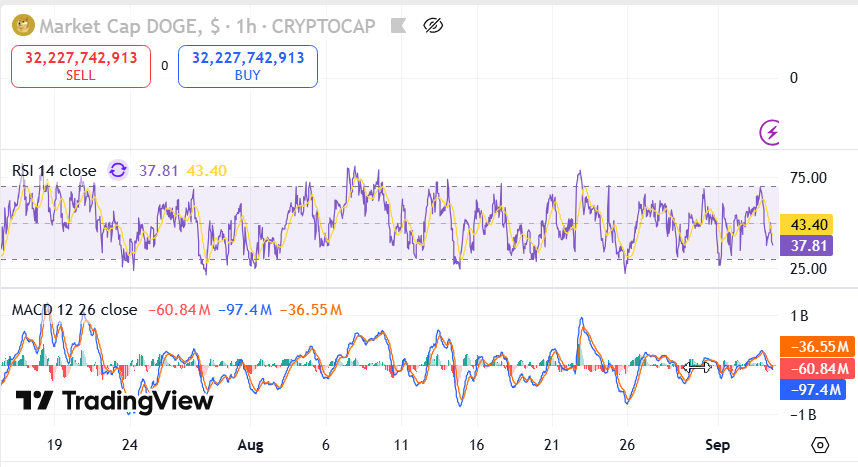
The Moving Average Convergence Divergence (MACD) further strengthens the analysis. Data shows the MACD line at -53.23M, the signal line at -74.19M, and the histogram at -20.96M. This reflects easing bearish pressure compared to earlier declines.
The market capitalization chart confirms near-equal buy and sell activity, both standing at $32.34 billion. Such balance underscores a period of measured activity as technical tools weigh heavily on trader sentiment.
Overall, DOGE remains in a compressed range while technical tools provide fresh setups. With RSI stabilization, MACD easing, and TD Sequential flashing a buy, the charts highlight important levels that traders are now observing.
Earn more PRC tokens by sharing this post. Copy and paste the URL below and share to friends, when they click and visit Parrot Coin website you earn: https://parrotcoin.net0
PRC Comment Policy
Your comments MUST BE constructive with vivid and clear suggestion relating to the post.
Your comments MUST NOT be less than 5 words.
Do NOT in any way copy/duplicate or transmit another members comment and paste to earn. Members who indulge themselves copying and duplicating comments, their earnings would be wiped out totally as a warning and Account deactivated if the user continue the act.
Parrot Coin does not pay for exclamatory comments Such as hahaha, nice one, wow, congrats, lmao, lol, etc are strictly forbidden and disallowed. Kindly adhere to this rule.
Constructive REPLY to comments is allowed