

- Ethereum targets $4,095 resistance as bullish sentiment builds, with $3,000 support critical for sustaining momentum.
- Fibonacci levels reveal strong support at $3,000 and resistance at $3,600, signaling the potential for recovery and market gains.
- Market psychology and liquidity dynamics highlight unpredictability, with traders eyeing $4,879 ATH as a psychological milestone.
Ethereum shows strong market activity with price movements reflecting bullish potential and short-term resistance. Analysts highlight critical levels, patterns, and sentiment shifts as traders navigate the volatile landscape.
Consolidation Fuels Bullish Momentum
The latest price trajectory of Ethereum shows a strong recovery after a period of consolidation around $3,100 to $2,800. This accumulation-driven phase resulted in a breakout and following climb above $3,500. The upward momentum shows growing market optimism, yet resistance near $4,095 has tempered immediate gains.
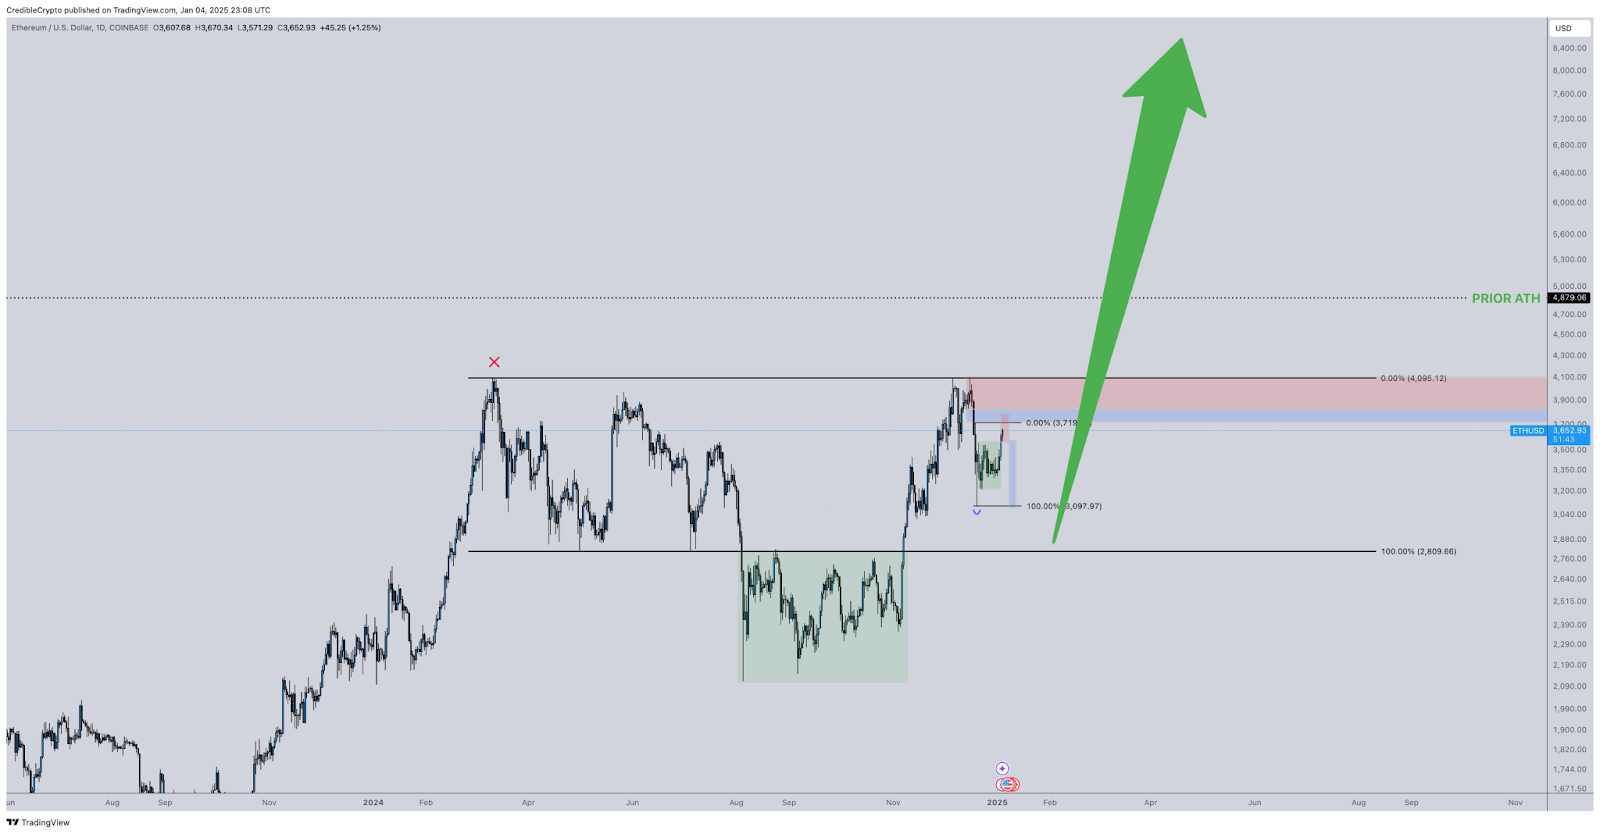
Source: CrediBull Crypto
Ethereum’s previous all-time high (ATH) of $4,879 looms as a psychological target. Traders are closely monitoring this level for a potential breakout. Moreover, the retracement after the $4,095 resistance has resulted in a smaller consolidation zone above $3,500. This behavior, highlighted within a blue rectangle, suggests a market pause to gather momentum.
Additionally, Fibonacci retracement levels between $2,809 and $4,095 serve as key reference points. These levels highlight support and resistance zones that could guide Ethereum’s next moves. As market sentiment leans bullish, the green upward arrow on the chart hints at an optimistic trajectory toward the ATH.
Liquidity and Market Psychology
On a shorter 4-hour timeframe, Ethereum’s price dynamics reflect heightened trader activity around $3,600 and $3,000. A strong rejection from the $3,600 resistance triggered a sharp pullback, leading to consolidation near $3,100. StefanB emphasizes liquidity as a critical driver, suggesting markets often act unpredictably to disadvantage the majority.
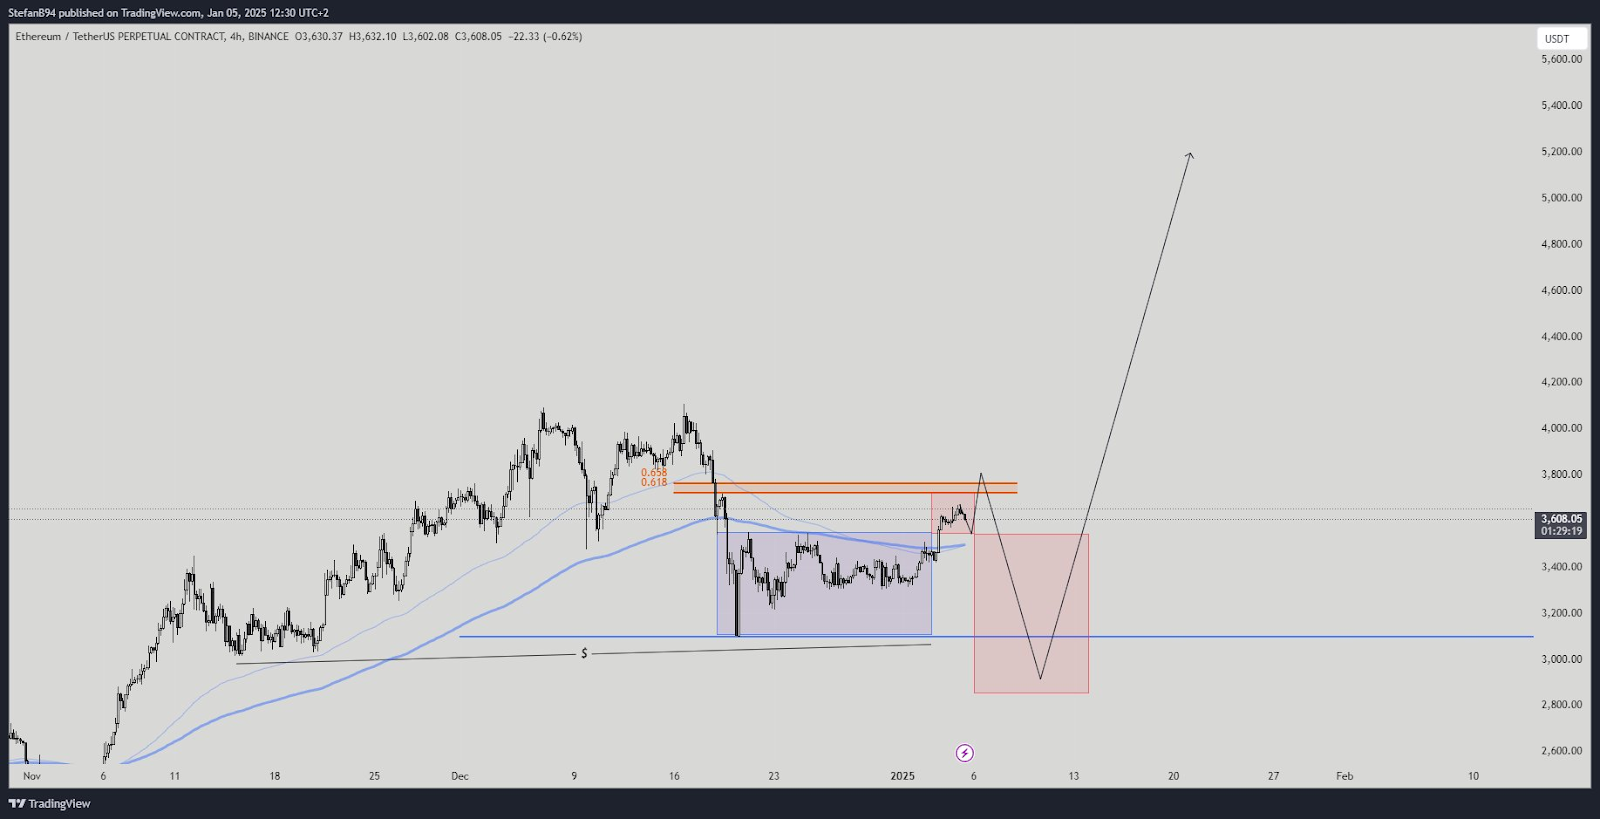
Source: StefanB
The bearish wave structure has corrections aligning near $3,200. However, the “W” pattern forming indicates a potential bullish recovery, especially if Ethereum breaks above $3,600 and the 200-moving average. Furthermore, the Fibonacci retracement and moving averages add clarity. These tools highlight seller activity near $3,600 and robust support at $3,000. Sustained trading above the $3,000 blue horizontal line signals strength, but a breach could prompt further declines.
The post Ethereum Eyes $4,095 Resistance Amid Bullish Momentum and Key Market Signals appeared first on Crypto News Land.
Earn more PRC tokens by sharing this post. Copy and paste the URL below and share to friends, when they click and visit Parrot Coin website you earn: https://parrotcoin.net0
PRC Comment Policy
Your comments MUST BE constructive with vivid and clear suggestion relating to the post.
Your comments MUST NOT be less than 5 words.
Do NOT in any way copy/duplicate or transmit another members comment and paste to earn. Members who indulge themselves copying and duplicating comments, their earnings would be wiped out totally as a warning and Account deactivated if the user continue the act.
Parrot Coin does not pay for exclamatory comments Such as hahaha, nice one, wow, congrats, lmao, lol, etc are strictly forbidden and disallowed. Kindly adhere to this rule.
Constructive REPLY to comments is allowed