

- JasmyCoin’s chart reveals a breakout potential with bullish signs amidst recent consolidation and bearish trends.
- Fibonacci retracement and RSI indicate neutral market sentiment, with a looming shift in momentum as MACD flattens.
- Elliott Wave analysis suggests structured patterns in JasmyCoin’s price, forecasting a bullish target near $0.447424.
A popular crypto analyst has recently predicted a potential 20,080% surge for JasmyCoin (JASMY). The analyst anticipates a rise to $4.47842, a major leap from current prices. An in-depth look at the chart reveals the complexity of this bold forecast, offering insights into the factors supporting this bullish outlook.
Price Movement and Trendlines
Initially, the JasmyCoin price chart displays a sharp decline from early 2021, leading to a downward trendline that reflects the bearish phase. After the decline, a prolonged consolidation period ensued, marked by minor upward and downward movements.
These movements formed lower highs and lower lows, indicating a consistent bearish trend. Notably, a potential breakout point from this downtrend is visible, hinting at a possible change in trend direction.
Further, the chart illustrates a critical transition with the inclusion of red triangles and green arrows, which likely denote resistance and support levels, respectively. The red triangles represent price points where the market failed to move higher, thus continuing the downward trajectory.
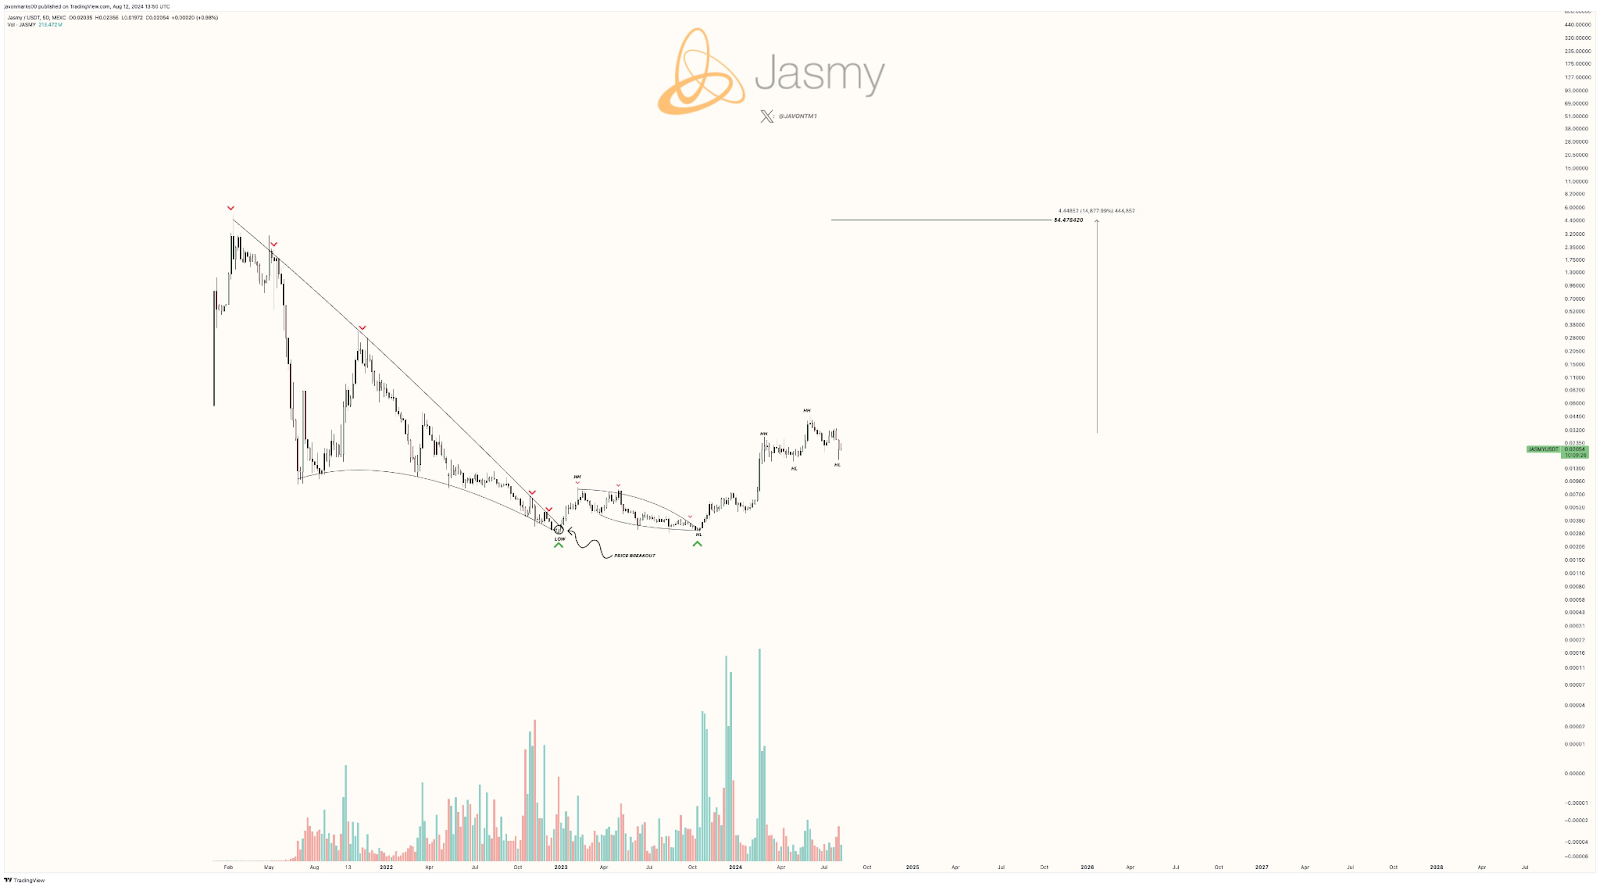
Source: @JavonTM1 on X
Conversely, green arrows indicate support levels, suggesting price reversals upward. Additionally, the chart highlights a breakout point, signaling a potential bullish reversal, supported by visible spikes in trading volume.
Fibonacci Retracement and Indicators
A 4-hour chart sourced from Binance provides a view with candlestick price movements, Fibonacci retracement levels, RSI, and MACD indicators. After a peak of $0.03351, the price descended to a low of approximately $0.01584, navigating various Fibonacci retracement levels along the way. The current price level around $0.02053 suggests consolidation, notably testing support near the 0.236 Fibonacci level.
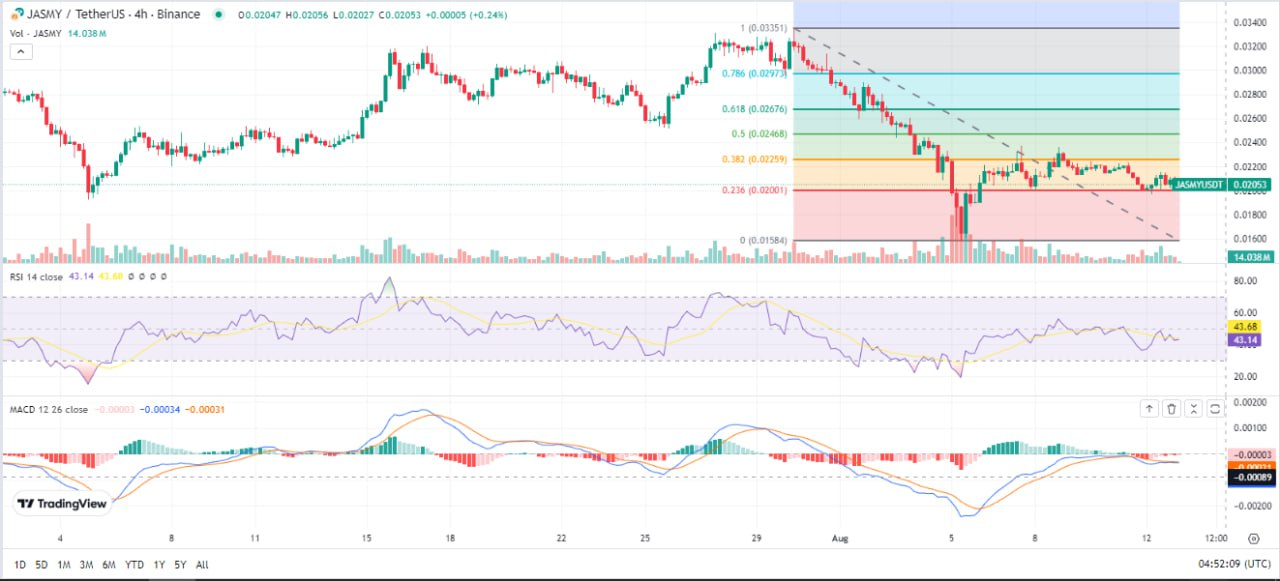
Source: CryptoRank
The RSI, standing at 43.14, indicates neither overbought nor oversold conditions, thus signaling a neutral market sentiment. Meanwhile, the MACD line, slightly below the signal line, hints at a bearish momentum. The MACD histogram’s negative values reinforce this sentiment, though a flattening MACD line could signal a potential momentum shift if it crosses above the signal line.
Elliott Wave Analysis and Potential Targets
Elliott Wave theory analysis, suggests structured wave patterns in JasmyCoin’s price movements. Annotations on the chart label different wave patterns, including W, X, and Y, providing a framework for predicting future price actions based on historical trends. The chart’s projected price target, marked by a horizontal line, indicates a bullish forecast with a potential target price of around $0.447424.
The post JASMY Price Set for Massive 20,080% Surge as Analyst Predicts Breakout to $4.47842 appeared first on Crypto News Land.
Earn more PRC tokens by sharing this post. Copy and paste the URL below and share to friends, when they click and visit Parrot Coin website you earn: https://parrotcoin.net0
PRC Comment Policy
Your comments MUST BE constructive with vivid and clear suggestion relating to the post.
Your comments MUST NOT be less than 5 words.
Do NOT in any way copy/duplicate or transmit another members comment and paste to earn. Members who indulge themselves copying and duplicating comments, their earnings would be wiped out totally as a warning and Account deactivated if the user continue the act.
Parrot Coin does not pay for exclamatory comments Such as hahaha, nice one, wow, congrats, lmao, lol, etc are strictly forbidden and disallowed. Kindly adhere to this rule.
Constructive REPLY to comments is allowed