

- PEPE trades at $0.059229, down 13.2% in seven days, holding between $0.059062 support and $0.05946 resistance.
- RSI and MACD readings highlight subdued momentum, reinforcing consolidation within a compressed price structure.
- Performance against Bitcoin (0.0108560 BTC, +1.6%) and Ethereum (0.082336 ETH, +0.1%) shows limited relative movement.
Pepe(PEPE) is trading at $0.059229, which represents a 13.2 % change in the last seven days. The setback notwithstanding, the token still lingers around a specific support area that has been very important in the recent sessions. According to market data, the support and resistance are at $0.059062 and at $0.05946 respectively.
This tight spread serves to highlight the squeeze of price action with lower highs continuing on a down trendline. With traders observing repeated rebounds near support, attention remains fixed on whether the restricted corridor will give way to expanded volatility.
Support and Resistance Define Narrow Range
PEPE has been trading in a narrow band over the last 24 hours and short-term boundaries have been established by support and resistance levels. The repetitive testing of these thresholds points to the low volatility with the focus on the conservative location of market players.
Price compression at these levels has restricted movement, keeping the asset pinned between the established floor and ceiling. This structure reflects the persistence of selling pressure as each recovery attempt struggles to extend beyond resistance.
Performance Relative to Major Assets
Relative performance against leading cryptocurrencies offers additional context. PEPE against Bitcoin is exchanging at 0.0108560 BTC which is a 1.6 percentage difference in the same period as compared to that of Bitcoin. Comparing it to Ethereum, the token is at 0.082336 ETH and the difference is 0.1%.
These values indicate muted performance when measured against broader market leaders. However, the defense of support has remained notable, with repeated rebounds reinforcing the significance of the current trading structure.
Indicators Reflect Ongoing Consolidation
Technical indicators further reinforce the picture of consolidation. The RSI has fluctuated between 39.37 and 54.64, pointing to restrained momentum within neutral territory. At the same time, MACD values reflect tight alignment, with histogram movements confirming subdued strength in either direction.
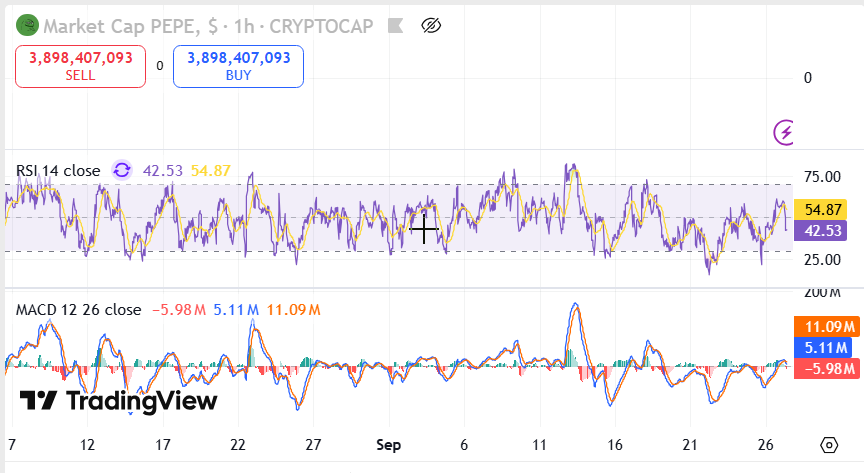
Combined, these indicators emphasize ongoing balance between buying and selling pressure. As the token remains locked within this compressed structure, the reaction around support and resistance will likely determine the next significant price adjustment.
PEPE continues to trade within a compressed structure defined by support and resistance. Indicators highlight muted momentum, leaving upcoming sessions crucial as traders await whether consolidation sustains or breaks, setting the stage for the next decisive market move.
Earn more PRC tokens by sharing this post. Copy and paste the URL below and share to friends, when they click and visit Parrot Coin website you earn: https://parrotcoin.net0
PRC Comment Policy
Your comments MUST BE constructive with vivid and clear suggestion relating to the post.
Your comments MUST NOT be less than 5 words.
Do NOT in any way copy/duplicate or transmit another members comment and paste to earn. Members who indulge themselves copying and duplicating comments, their earnings would be wiped out totally as a warning and Account deactivated if the user continue the act.
Parrot Coin does not pay for exclamatory comments Such as hahaha, nice one, wow, congrats, lmao, lol, etc are strictly forbidden and disallowed. Kindly adhere to this rule.
Constructive REPLY to comments is allowed