

- Shiba Inu is playing in a narrow accumulation band, with the range being between $0.00001258 and $0.00001300, which contains volatility.
- Technical signals are also neutral and RSI is almost at 53 and MACD is approaching flat indicating that the market is still in the process of consolidation.
- The level of support and resistance remains strong meaning traders are waiting until they see a verified breakout before deciding to change positions.
Shiba Inu has been languishing in tight accumulation against Tether (USDT), which shows a lack of volatility in recent sessions. Its cryptocurrency is currently trading at $0.00001268 and it is noticeably increasing by 0.1 percent within the past 24 hours.
In this period, SHIB was trading with a narrow range of $00001258 to.00001300 which suggests short-term consolidation.This movement is preceded by a slow recovery after the past retraction levels that have manifested after the preceding upward price movement. The emerging structure of the market suggests a stable positioning of the market because traders are waiting to get additional confirmation of the direction
Narrow Range Defines Market Behavior
The chart data shows SHIB’s price forming consistent rectangular consolidation zones, representing areas of accumulation. These zones have emerged after each notable upward movement, highlighting a phase of measured price stability. The repeated appearance of this pattern, visible on both short and mid-term charts, underscores the restrained volatility now shaping the market.
The support is currently at the mark of 0.00001258 and has been tested several times in the last several sessions. In the meantime, the upward movement is still limited by a resistance of $0.00001300.The present arrangement shows that the traders are holding balanced positions and monitoring the possible breakout triggers. It is important to note that SHIB has a trading pair with Bitcoin value of 0.091020 BTC and with Ethereum, a value of 0.082707 ETH, which is stable across markets.
Technical Indicators Suggest Consolidation Continuation
Technical indicators are another confirmation of the consolidation stage. Relative Strength Index (RSI) indicates a range of values of between 42.12 to 53.25, which indicates neutral momentum with no undue buying or selling strength.
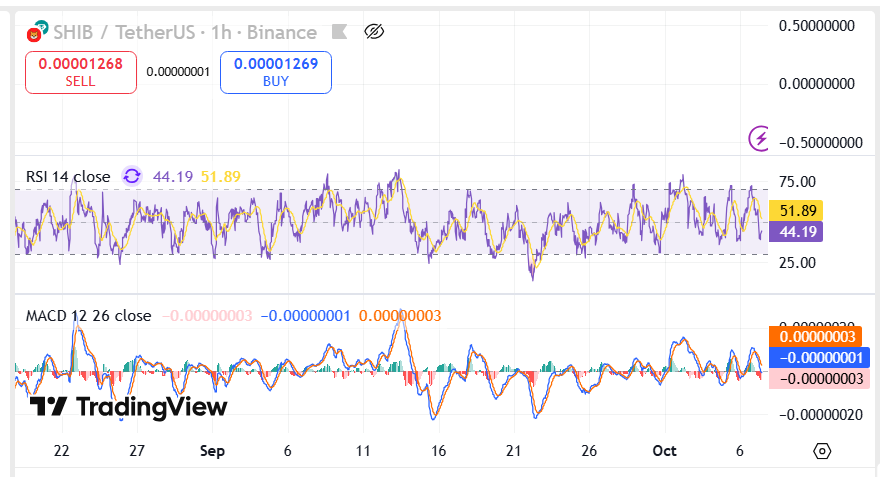
In the same light, the Moving Average Convergence Divergence (MACD) indicator is close to its equilibrium line. Histogram shows that there is insignificant difference between the signal and MACD lines that are indicating low volatility.
This technical positioning suggests the market is maintaining a balanced stance after previous fluctuations. Moreover, the accumulation structure visible on the hourly chart resembles earlier formations that preceded brief upward movements. The data collectively indicate that traders are monitoring this stabilization zone closely, as price compression often precedes notable changes in direction.
Earn more PRC tokens by sharing this post. Copy and paste the URL below and share to friends, when they click and visit Parrot Coin website you earn: https://parrotcoin.net0
PRC Comment Policy
Your comments MUST BE constructive with vivid and clear suggestion relating to the post.
Your comments MUST NOT be less than 5 words.
Do NOT in any way copy/duplicate or transmit another members comment and paste to earn. Members who indulge themselves copying and duplicating comments, their earnings would be wiped out totally as a warning and Account deactivated if the user continue the act.
Parrot Coin does not pay for exclamatory comments Such as hahaha, nice one, wow, congrats, lmao, lol, etc are strictly forbidden and disallowed. Kindly adhere to this rule.
Constructive REPLY to comments is allowed