

- Solana trades at $230.99 with 2.55% daily gain and $125.94B market cap.
- The asset broke a year-long downtrend with October’s monthly close above resistance.
- Market activity shows consistent higher lows since mid-2025 following a recovery from below $150.
Solana, a high-performance public blockchain and decentralized network that enables fast, secure, and affordable digital transactions and smart contracts has caught the attention of many. During today’s Asian trading session, SOL opened it market with an exchanging price value of $232.79, this opening price has remained stable as the asset enjoys over 18% weekly gain.
What is the Current Price Action?
Tracking the ongoing price trend at the time of press, a CoinMarketCap report on the daily performance reveals that Solana traded at $230.99 with a daily gain of 2.55% in the latest session. Its market capitalization reached $125.94 billion, advancing 2.86% during the same period. Trading volume stood at $9.1 billion within 24 hours, marking a 13% rise.
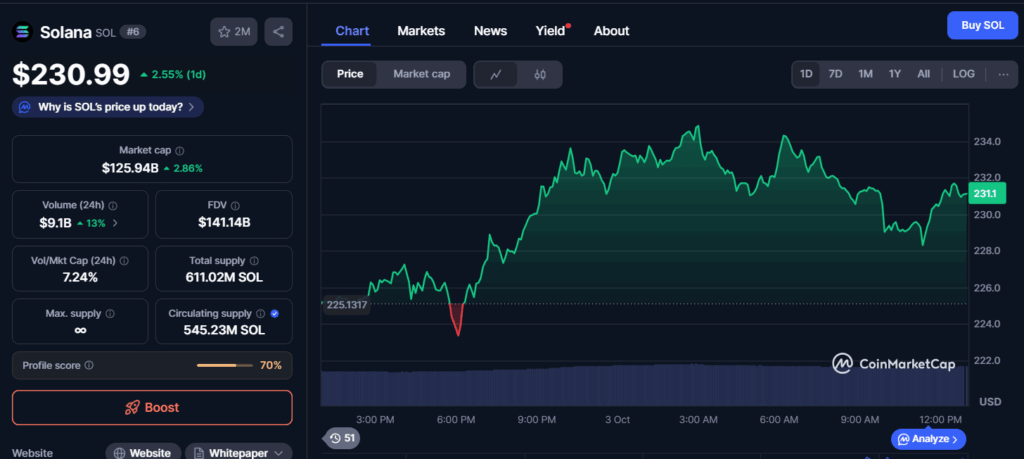
The chart recorded a brief decline near $225 before a recovery pushed prices higher. Following that movement, Solana climbed past $232 through late night and early morning activity. The trading range fluctuated actively between $230 and $234, indicating strong participation across sessions.
After approaching $234, the asset retreated yet held support above $228 during early morning levels. By midday, prices advanced again, returning above $231 and stabilizing into the most recent update. With market cap growth and stronger trading volumes, the 24-hour period displayed consistent price changes and heightened activity.
Solana Breaks Year-Long Downtrend With Monthly Close Above Resistance
As the asset has exhibited a stable price trend over the last few days, market analysts have observed a distinct market pattern. According to an analysis prepared by Rekt Capital, Solana recorded a notable shift on its monthly chart as October began. The previous month ended beneath a descending trendline that has defined the broader downtrend since early 2024. With the new candle, Solana advanced above the same boundary, positioning it as support.

The break indicates a departure from the lower highs that contained price action for nearly a year. During 2024 and early 2025, repeated efforts to breach the descending line were met with rejection, resulting in sharp declines. Mid-2025 readings placed the price below $150, marking the low before a recovery phase began. After mid-2025, Solana registered higher lows across several months, gradually moving closer to the macro trendline.
October’s performance reflects movement above that threshold, establishing a new technical level for observation. Looking further back, the chart captures Solana’s strong acceleration during 2023, when the price rose from below $25 to above $200. That surge was followed by consolidation phases, marked by alternating red and green candles, which extended until this recent breakout formation appeared.
Earn more PRC tokens by sharing this post. Copy and paste the URL below and share to friends, when they click and visit Parrot Coin website you earn: https://parrotcoin.net0
PRC Comment Policy
Your comments MUST BE constructive with vivid and clear suggestion relating to the post.
Your comments MUST NOT be less than 5 words.
Do NOT in any way copy/duplicate or transmit another members comment and paste to earn. Members who indulge themselves copying and duplicating comments, their earnings would be wiped out totally as a warning and Account deactivated if the user continue the act.
Parrot Coin does not pay for exclamatory comments Such as hahaha, nice one, wow, congrats, lmao, lol, etc are strictly forbidden and disallowed. Kindly adhere to this rule.
Constructive REPLY to comments is allowed