

- Solana is on a bullish move, recently breaking past key resistance levels, with a target of $1,300.
- The price shows volatility, with higher highs and higher lows forming a strong trend.
- OBV indicates buying pressure, confirming a solid accumulation phase.
Solana continues to exhibit promising price movements, maintaining a healthy market structure. In the last few months, SOL has demonstrated volatility, but its overall trajectory points to a bulls course. With a recent breakout from a cup-and-handle pattern, the cryptocurrency is now eyeing a potential price target of $1,300.
Current Market Action Revealed
A look at the current price trend, CoinMarketCap data reveals that the Solana price chart shows the asset trading at $222.86, with a slight increase of 0.27% in the last 24 hours. Over the past day, the price fluctuated between a low of $222.01 and a high nearing $230.
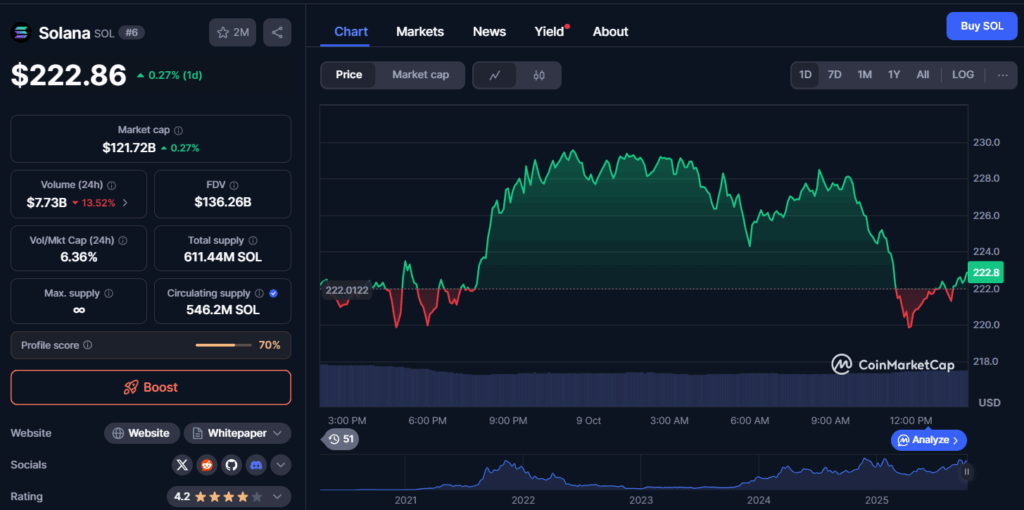
The price trend exhibits some volatility, with alternating green and red movements indicating shifts in market sentiment. Volume traded over the past 24 hours stands at $7.73 billion, down 13.52%. The market cap is currently $121.72 billion, reflecting a moderate 0.27% increase. A slight uptick in price has been observed, as the asset approaches the upper end of its current trading range.
Solana Maintains Bullish Trend with Consistent Price Movements
According to an observation by IncomeSharks on X, it has been revealed taht the price movements of Solana ($SOL) against the US Dollar have demonstrated a strong bullish trend. The chart shows a clear upward trajectory, with the price consistently moving within parallel ascending lines.
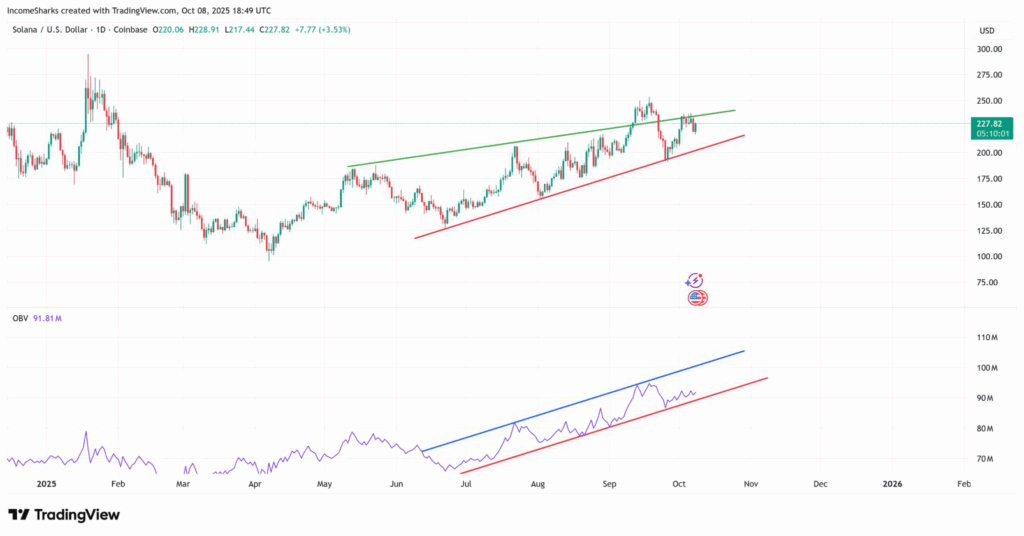
These lines show that the asset has been developing a tendency of increased highs and increased lows. The indicator placed below the price chart is the On-Balance Volume (OBV) which is generally upward sloping. This trend in OBV implies an augmentation in buying pressure.
In spite of this positive trend, there has been no sharp spike but this would normally show the stronger accumulation phase. The price chart has a resistance area that is indicated by a red line, which is considered a support zone against the downward movements. So far as the price is placed on top of this support, the bullish trend will continue. Any fall below this may indicate a change in the market momentum.
SOL Breaks Out of Cup-and-Handle Pattern, Eyes $1,300 Target
To further validate the bullish trend, another analysis by Ali Charts reveals that SOL displays a strong upward trajectory, breaking past resistance levels. The chart illustrates a cup-and-handle pattern, with a notable price rise from approximately $20 in mid-2022 to around $230 in October 2025.
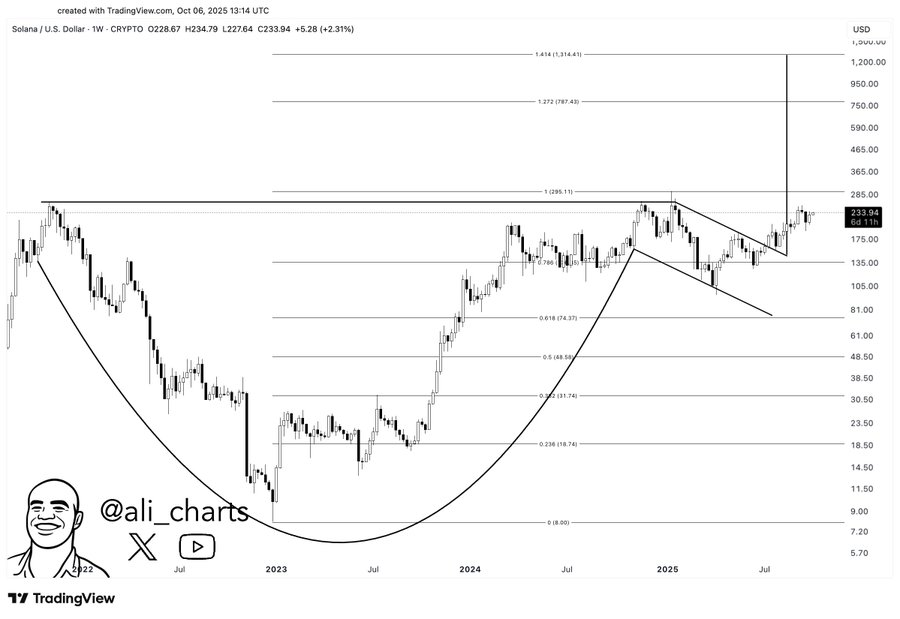
The pattern appears to confirm a breakout as the price tests key Fibonacci retracement levels, such as the 0.618 and 0.236 marks. The chart shows clear price swings, marked by peaks and troughs, forming the left side of the cup. The breakout above $230 suggests potential for future increases, with a target price near $1,300 based on the pattern’s projected extension.
Earn more PRC tokens by sharing this post. Copy and paste the URL below and share to friends, when they click and visit Parrot Coin website you earn: https://parrotcoin.net0
PRC Comment Policy
Your comments MUST BE constructive with vivid and clear suggestion relating to the post.
Your comments MUST NOT be less than 5 words.
Do NOT in any way copy/duplicate or transmit another members comment and paste to earn. Members who indulge themselves copying and duplicating comments, their earnings would be wiped out totally as a warning and Account deactivated if the user continue the act.
Parrot Coin does not pay for exclamatory comments Such as hahaha, nice one, wow, congrats, lmao, lol, etc are strictly forbidden and disallowed. Kindly adhere to this rule.
Constructive REPLY to comments is allowed