

- SUI’s chart shows a recurring “sideways-pump” structure, hinting at a possible upcoming breakout.
- A 6.79% rise in 24-hour volume suggests active market participation, but momentum may still be limited.
- Despite bullish patterns, broader market sentiment and liquidity conditions will determine the next price move.
The price trajectory of SUI, currently trading at $3.14, continues to spark conversations among market watchers. While the digital asset is facing a short-term dip of 1.86% over the last 24 hours, broader historical patterns suggest a potential breakout.
A comparative chart analysis reveals a repeating formation of “sideways-pump” cycles, with the current market phase aligning closely with previous accumulation stages. However, this setup alone doesn’t confirm an immediate rally, as external market conditions and liquidity metrics present a more nuanced picture.
SUI Nears Potential Breakout as Historical Pattern Repeats
Based on historical data patterns, SUI has followed a recurring structure: a sideways consolidation phase followed by a sharp upward movement. This has been identified multiple times since mid-2023. A recent chart marks the current point as another similar accumulation phase, indicating that the asset may be nearing another breakout. The visual roadmap shared by some market analysts suggests that if this cycle repeats, a rally could push the token toward the $6 to $7 range.
However, past patterns, while informative, are not always predictive. The asset’s previous upward moves came during periods of increased market-wide optimism and capital inflows, factors that may not be fully present in the current landscape.
SUI Builds Momentum, But Breakout Uncertain
Supporting metrics from CoinMarketCap show a 24-hour trading volume of $732.23 million, up 6.79%, indicating continued investor interest. The circulating supply currently stands at 3.39 billion SUI out of a total capped at 10 billion, giving it a market cap of $10.67 billion.
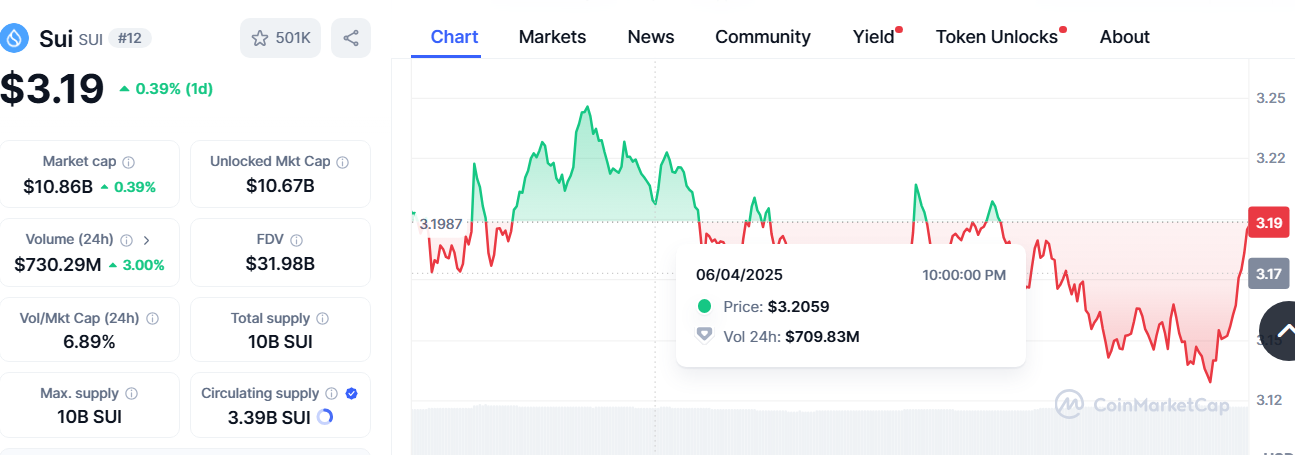
While these figures show active participation, the volume-to-market cap ratio of 6.89% may suggest that the momentum isn’t yet strong enough to sustain a major breakout.
Although the technical chart signals optimism, market observers caution against viewing the pattern in isolation. In summary, while historical patterns in SUI’s price chart point toward a potential rally, the asset’s next move depends on a convergence of technical support and external market triggers.
Earn more PRC tokens by sharing this post. Copy and paste the URL below and share to friends, when they click and visit Parrot Coin website you earn: https://parrotcoin.net0
PRC Comment Policy
Your comments MUST BE constructive with vivid and clear suggestion relating to the post.
Your comments MUST NOT be less than 5 words.
Do NOT in any way copy/duplicate or transmit another members comment and paste to earn. Members who indulge themselves copying and duplicating comments, their earnings would be wiped out totally as a warning and Account deactivated if the user continue the act.
Parrot Coin does not pay for exclamatory comments Such as hahaha, nice one, wow, congrats, lmao, lol, etc are strictly forbidden and disallowed. Kindly adhere to this rule.
Constructive REPLY to comments is allowed