
Bitcoin is currently hovering around a crucial price zone, caught between bearish pressure and bullish resilience. After testing support near the $110K level, BTC price now faces a defining moment that could set the tone for its next major move. A breakdown below $110K may trigger accelerated selling, opening the door for a deeper correction, while a rebound toward $115K could restore bullish momentum and attract fresh buying interest. Market volatility remains heightened as traders closely monitor liquidity zones, institutional flows, and macroeconomic signals. The coming sessions may decide whether Bitcoin stabilises or enters a broader correction phase.
Large Holders Add to Market Sell-Off
The start of the week attracted significant selling pressure that drove the Bitcoin price from the consolidated range above $115K to the local lows below $112,000. The volume rose from around $20 billion to more than $66 billion, which hinted towards excessive selling from the investors. However, the on-chain data suggests that it was the large holders or the whales who have booked the profit.
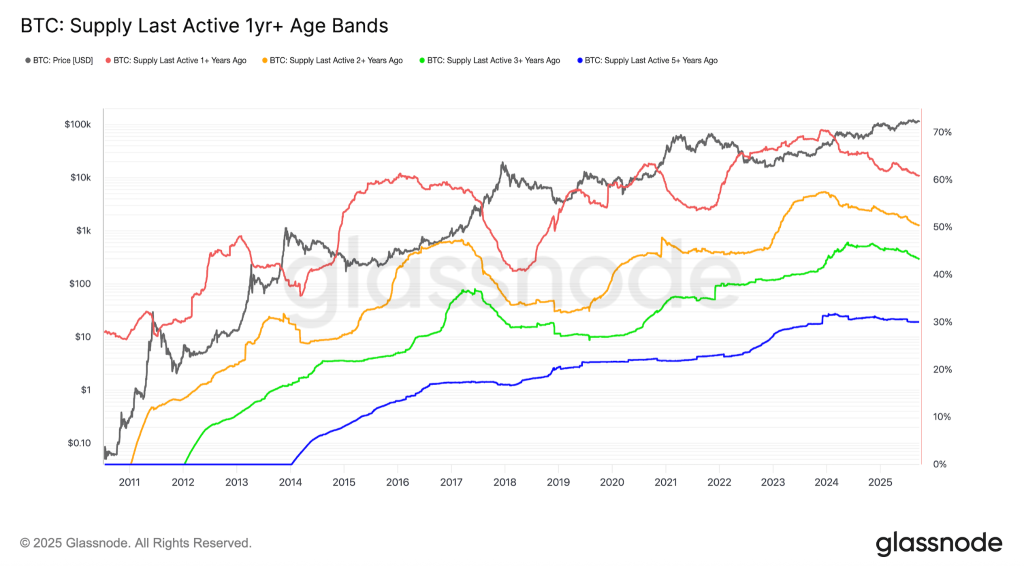
The data from Glassnode indicates that selling pressure has accumulated as whales have been selling extensively. Every wallet cohort, holding over 10,000 BTC, is in the distribution phase as the long-term holder supply is declining. Over the past few months, the supply has dropped from 70% to 60%, and the supply for over two years has declined to 52% from 57%. The above metric measures the relative accumulation based on the size and volume of tokens acquired over the past 15 days.
What’s Next? Will BTC Price Plunge Below $110K?
Ever since the price faced a rejection from $120K, the rally has remained largely bearish. The star token dropped over 13%, but the bulls quickly initiated a recovery. Despite the recovery, the price remains within the consolidated range. As a result, the bearish influence over the rally continues to persist, keeping the bearish targets active.
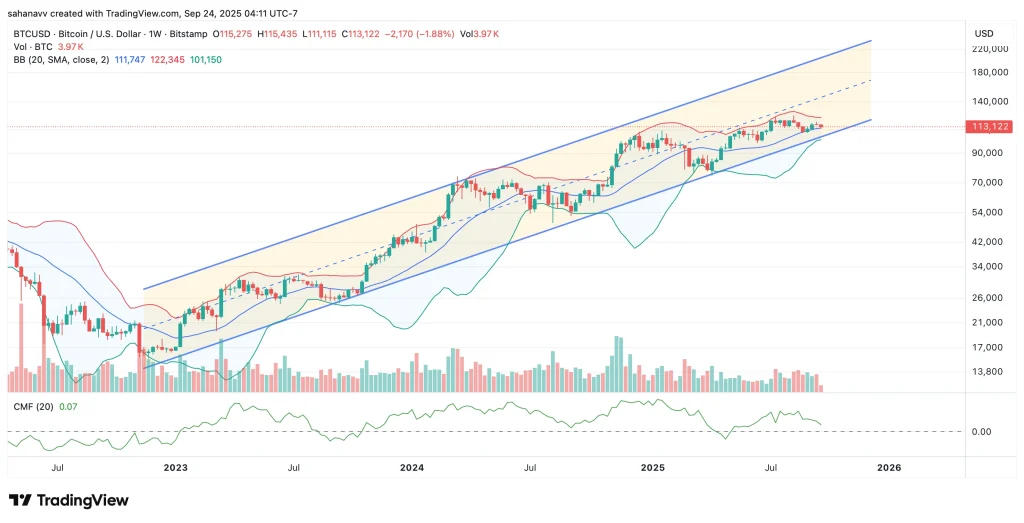
The HTF chart of Bitcoin suggests the price has been maintaining a steep ascending trend within a rising parallel channel. The weekly Bollinger bands are compressing, suggesting a drop in volatility as the volume is depleting. On the other hand, the Chainkin Money Flow (CMF) is heading back to 0, hinting towards the rise in selling pressure. The traders appear to be pulling money out of Bitcoin, which can weigh on the price. Therefore, the long-term price action of Bitcoin hints towards an extended bearish action, leading the levels to the lower bands of Bollinger in the short term.
Wrapping it Up!
The whale sell-offs have been a major reason behind the latest pullback and depleting volatility. However, the star token has been sustained within a bullish range and after the upward pressure fades, the Bitcoin (BTC) price is expected to undergo a small pullback, followed by a strong rebound to its initial levels.
Earn more PRC tokens by sharing this post. Copy and paste the URL below and share to friends, when they click and visit Parrot Coin website you earn: https://parrotcoin.net0
PRC Comment Policy
Your comments MUST BE constructive with vivid and clear suggestion relating to the post.
Your comments MUST NOT be less than 5 words.
Do NOT in any way copy/duplicate or transmit another members comment and paste to earn. Members who indulge themselves copying and duplicating comments, their earnings would be wiped out totally as a warning and Account deactivated if the user continue the act.
Parrot Coin does not pay for exclamatory comments Such as hahaha, nice one, wow, congrats, lmao, lol, etc are strictly forbidden and disallowed. Kindly adhere to this rule.
Constructive REPLY to comments is allowed