
With the price of BTC reclaiming the $59,000 mark, the crypto market has recorded a jump of 0.78% in its global valuation. Moreover, Bitcoin-based tokens have followed the footsteps of BTC and recorded a similar price action by breaking out of their resistance levels.
Reportedly, some altcoins have recorded a two-digit surge since the past day. This highlights a rising bullish sentiment in the cryptocurrency market. With this, investors are curious about the short-term price action of the most Bitcoin-influenced tokens.
In this article, we have covered the in-depth sentiments and price action of the top 2 BRC-20 tokens for the upcoming weeks.
Ordi Price Displays Increased Bullish Action
With the rising price volatility, the ORDI price has jumped 10.17% in the past 24 hours with a trading volume of $208.56 Million. Moreover, it has recorded a neutral price action over the past week but has surged 8.75% during the past month. This highlights a positive outlook for the altcoin this week.
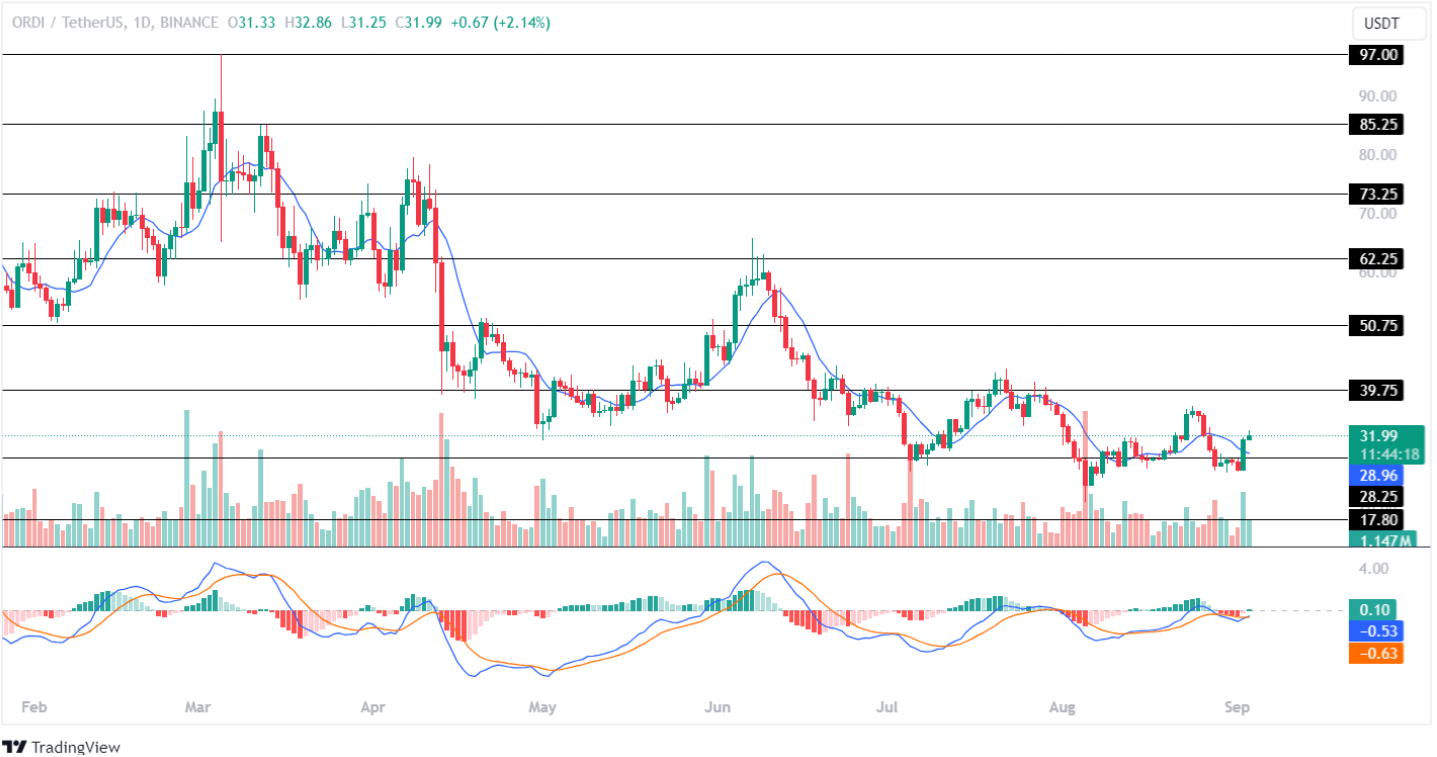
The Moving Average Convergence Divergence (MACD) has displayed a rising green histogram in the 1D time frame. Further, with a bullish convergence in its averages, the Ordi token displays increased bullish action in the crypto space.
If the market continues gaining momentum, the Ordi price will prepare to test its important resistance level of $39.75 this month. Conversely, a bearish reversal could result in this altcoin plunging toward its low of $17.80 in the coming time.
Read our ORDI Price Prediction for long-term targets
SATS Price Successfully Retests Its Support Trendline
After trading under a bearish influence for the last 8 days, the 1000SATS price has recorded a bullish recovery of ~5% in the past 24 hours. Furthermore, with a jump of 23.89% over the past month, this altcoin has formed an ascending channel pattern and continues trading within it.
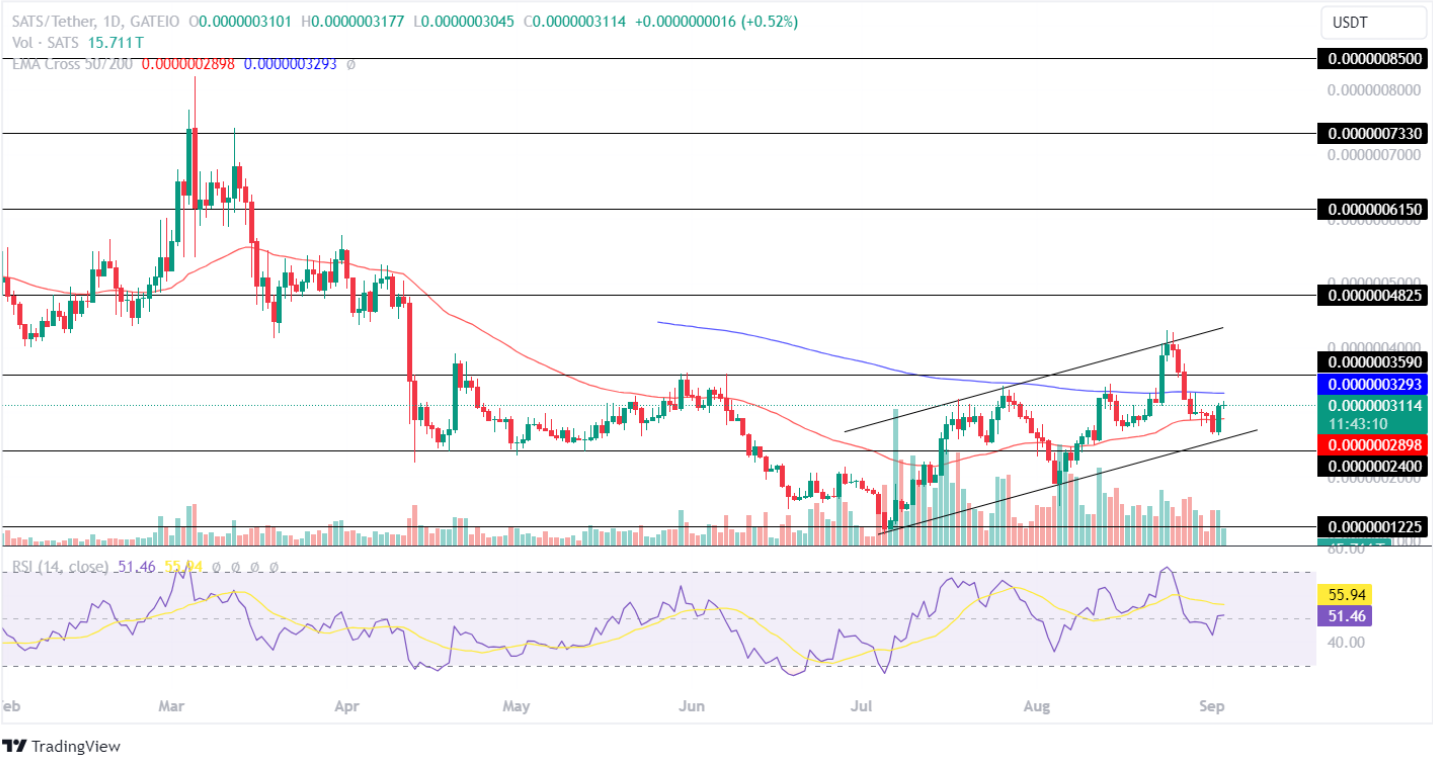
The Relative Strength Index (RSI) has surpassed its neutral point in the SATS price chart. Further, the EMA 50-day has recorded a bullish convergence whereas the EMA 200-day acts as a resistance to the price chart. This suggests a mixed sentiment for the SATS altcoin in the market.
Suppose, the bulls continue gaining momentum, in that case, the SATS coin price will test its resistance level of $0.000000359 in the coming time. On the flip side, a bearish action could result in it retesting its support trendline of the trend pattern.
Earn more PRC tokens by sharing this post. Copy and paste the URL below and share to friends, when they click and visit Parrot Coin website you earn: https://parrotcoin.net0
PRC Comment Policy
Your comments MUST BE constructive with vivid and clear suggestion relating to the post.
Your comments MUST NOT be less than 5 words.
Do NOT in any way copy/duplicate or transmit another members comment and paste to earn. Members who indulge themselves copying and duplicating comments, their earnings would be wiped out totally as a warning and Account deactivated if the user continue the act.
Parrot Coin does not pay for exclamatory comments Such as hahaha, nice one, wow, congrats, lmao, lol, etc are strictly forbidden and disallowed. Kindly adhere to this rule.
Constructive REPLY to comments is allowed