
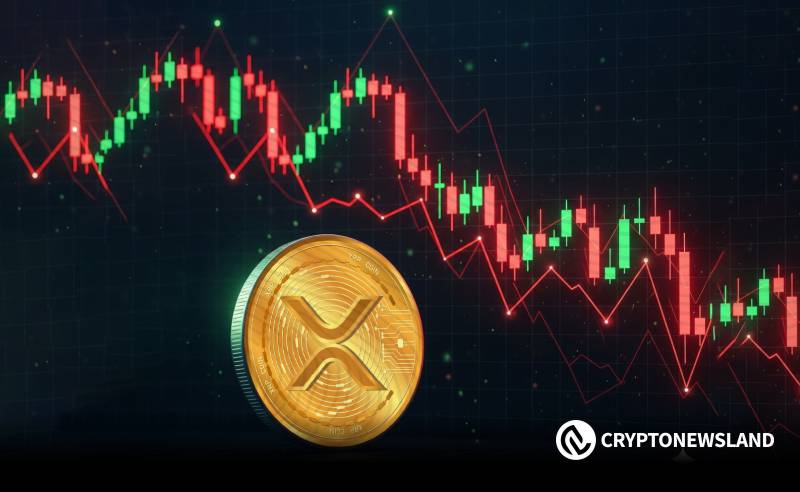
- XRP traded at $2.04 after a 9.9% weekly decline and stayed inside a narrow $2.03–$2.10 range.
- The heatmap showed denser liquidity clusters above $2.50, while lower levels displayed thinner distributions.
- Recent downward steps aligned with lighter liquidity pockets, which kept the price tracking the $2.03 support zone.
XRP remained trading around its weekly lows with the rest of the market keeping watch on the liquidity action on the higher-timeframe heatmap. The token declined by 9.9 percent in seven days to stand at $2.04 with support being established at the level of $2.03. This was the level that was obtained after the last pullback and formed a thin trading range between $2.03 and $2.10.
The heatmap displayed notable liquidity pockets above the current price, and these concentrations added context to the recent movement. The visible clusters showed heavier activity near the upper bands, while the lower side reflected thinner levels. This distribution shaped how the chart behaved over the past week and connected the current range to longer-term liquidity structures.
Liquidity Clusters Remain Denser Above the Market
The heatmap showed stronger liquidity above $2.50, and this density remained visible across the three-month view. These upper zones captured more activity than areas below the current range. However, the price continued to trade beneath these concentrations after the recent slide.
This setup linked the short-term decline with the broader structure that developed since late August. The chart also displayed repeated responses to higher-timeframe liquidity bands, which remained consistent across the observed period. The pattern created continuity between the weekly trend and the higher-timeframe readings.
Market Holds Local Support While Price Tracks Lower Band
The last sessions had seen XRP support the level of $2.03 and this maintained the lower band. The 24 hour movement remained within the $2.03 and $2.10 range with a steady reference in the short term trading. In particular, the chart contained a number of downward steps which coincided with the liquidity lighter regions under the midpoint. This alignment connected recent weakness with the structure visible on the heatmap. Each reaction formed near areas with reduced liquidity, creating a steady progression toward the lower band.
Heatmap Shows Strong Liquidity Clusters Above Price
The wider heatmap continued to highlight prominent clusters above the chart’s current position. These zones remained more concentrated than the pockets below the market. This contrast offered additional context for understanding the current stage of price movement. The visual distribution also connected the ongoing decline with earlier liquidity responses, forming a clear reference for how the market positioned itself across the higher-timeframe view.
Earn more PRC tokens by sharing this post. Copy and paste the URL below and share to friends, when they click and visit Parrot Coin website you earn: https://parrotcoin.net0
PRC Comment Policy
Your comments MUST BE constructive with vivid and clear suggestion relating to the post.
Your comments MUST NOT be less than 5 words.
Do NOT in any way copy/duplicate or transmit another members comment and paste to earn. Members who indulge themselves copying and duplicating comments, their earnings would be wiped out totally as a warning and Account deactivated if the user continue the act.
Parrot Coin does not pay for exclamatory comments Such as hahaha, nice one, wow, congrats, lmao, lol, etc are strictly forbidden and disallowed. Kindly adhere to this rule.
Constructive REPLY to comments is allowed